Volume Heatmap
GET /v1/analytics/volume/heatmap
Returns delivery volume spatially aggregated into H3 hexagonal cells, for rendering a heatmap. Given a cell and a target resolution, the API returns the delivery count for each of that cell's descendants at the requested resolution. Only cells with at least one delivery are returned.
Requires an API key sent as a Bearer token in the
Authorizationheader.
Request
Query Parameters
| Parameter | Type | Required? | Description |
|---|---|---|---|
cell | string | Yes | H3 cell index (hexadecimal string) for the area to query. Can be at any H3 resolution. Example: 862a1018fffffff |
resolution | integer | Yes | H3 resolution for the returned cells. Higher values mean smaller cells and more detail. Data is available at resolutions 3–11. Values below 3 are raised to 3. |
If resolution is finer (higher) than cell's own resolution, the response breaks cell down into its descendants at that resolution. If resolution is the same or coarser, the response instead rolls cell up to its first ancestor at that resolution.
A single request will descend at most 6 resolution levels finer than cell (for example, a resolution-3 cell can return data down to resolution 9, but not further in one call). Requesting more than that does not fail — the response is capped to the finest resolution the API will return in one request, and the response's resolution field always reflects what was actually used. Read it from the response rather than assuming it matches your request.
Example Request
curl "https://api.core.doorstep.ai/v1/analytics/volume/heatmap?cell=862a1018fffffff&resolution=9" \
  -H "Authorization: Bearer $API_KEY"
Response
- 200
- 400
- 401
- 500
Delivery counts aggregated into H3 cells.
Response Body
| Field | Type | Description |
|---|---|---|
resolution | integer | The H3 resolution actually used. May be coarser than requested; see above. |
cell | string | Echoes back the cell from the request. |
series | array of objects | One entry per H3 cell with at least one delivery. |
series[].count | integer | Delivery count in that cell. |
series[].h3 | string | The H3 cell index, as a hexadecimal string. |
Cells with zero deliveries are omitted. To render geometry, derive each hexagon's boundary client-side with an H3 library like h3-js and its cellToBoundary function.
Example Response
{
  "resolution": 9,
  "cell": "862a1018fffffff",
  "series": [
    {
      "count": 42,
      "h3": "892a1018803ffff"
    },
    {
      "count": 17,
      "h3": "892a1018807ffff"
    }
  ]
}
A required parameter is missing, for example cell or resolution was not provided.
{
  "status": 400,
  "code": "bad_request",
  "message": "Cell is required"
}
The API key is missing or invalid.
{
  "status": 401,
  "code": "unauthorized",
  "message": "Token Invalid"
}
Something went wrong on our end. Try the request again later.
{
  "status": 500,
  "code": "internal_server_error",
  "message": "Internal Server Error"
}
H3 Resolution Guide
| Resolution | Approximate cell area |
|---|---|
| 3 | ~12,393 km² (state-level) |
| 5 | ~252 km² (city-level) |
| 7 | ~5 km² (neighborhood-level) |
| 9 | ~0.1 km² (block-level) |
| 11 | ~2,150 m² (building-level) |
Higher resolutions mean smaller cells and more detail.
Example Usage
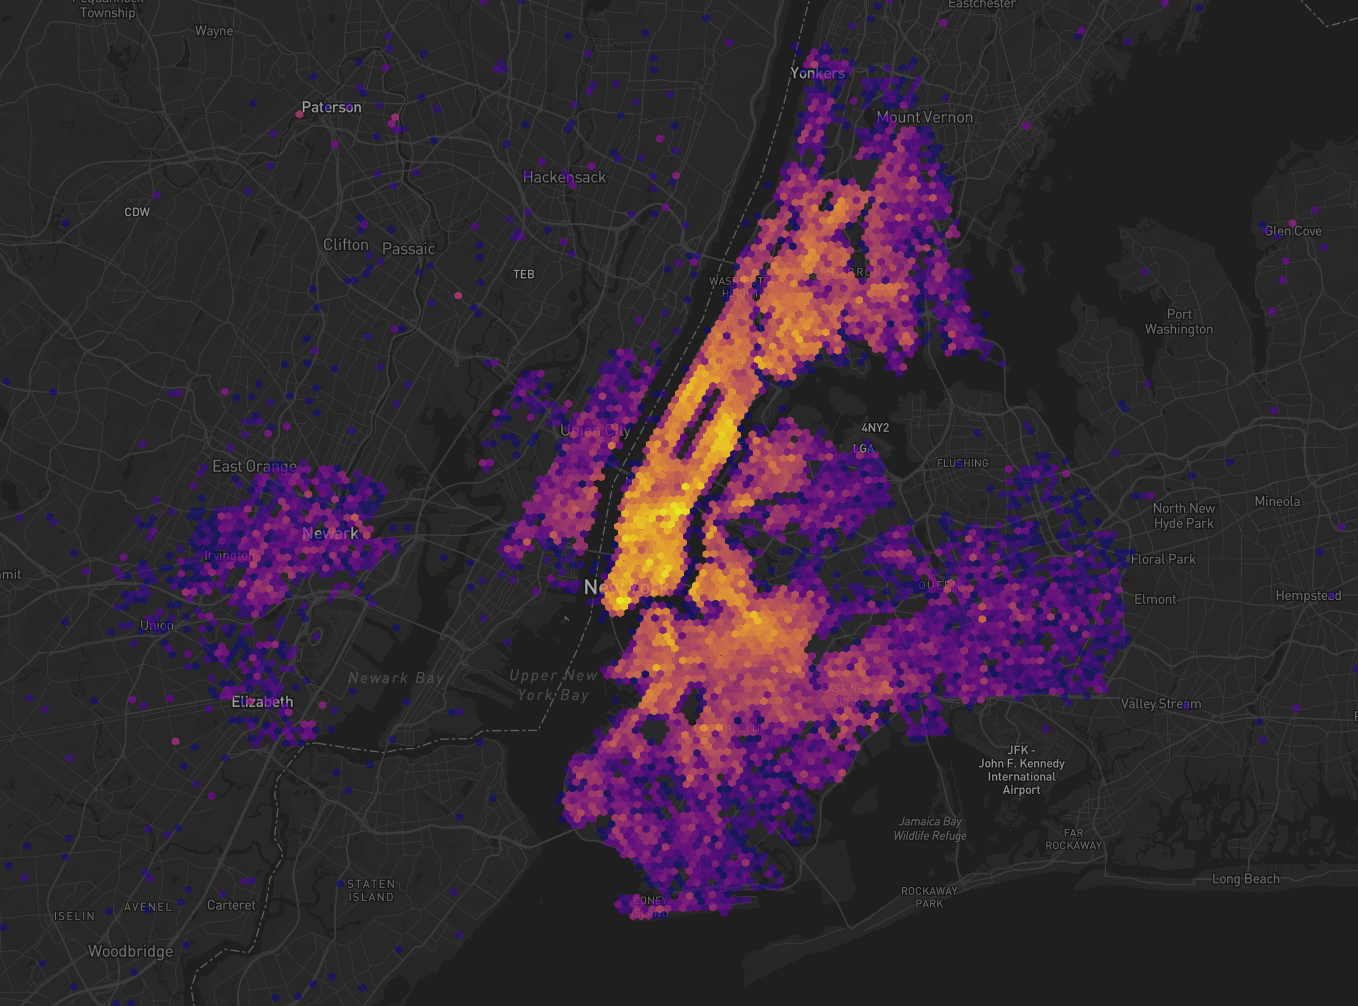
Common Applications
- Heatmap visualization of delivery density on a map
- Identifying high- and low-volume delivery zones
- Comparing coverage across regions